
Healthcare Analytics Platform
Analytics Infrastructure for Radiology
DImax delivers radiology analytics, workflow analytics, Turn Around Time tracking, shift and productivity reporting, follow-up management, charge capture audits, capacity and demand forecasting, and AI quality governance — transforming complex radiology data into actionable insights that drive operational performance.


Healthcare Analytics Suite
Complete Analytics Coverage for Radiology
Each product addresses a distinct need — and together they form a comprehensive platform that turns imaging data into clinical intelligence.
Radiology Analytics Platform
DImax is a comprehensive radiology analytics platform — connecting to RIS, PACS, scheduling systems, and billing platforms to deliver workflow analytics, productivity reporting, and operational intelligence.
- Radiology workflow analytics and performance dashboards
- Turn Around Time (TAT) tracking for all monitored workflows
- Shift and hourly productivity reporting
- Follow-up management and compliance tracking
- Charge capture audits and billing integration
- Capacity vs. demand forecasting and predictive analytics
- Radiology report entity-to-ontology creation via NLP
- wRVU and subspecialty performance metrics
- Real-time data normalization and enrichment
 Aliri AI
Clinical Intelligence & NLP
Aliri AI applies natural language processing to radiology reports to extract structured data, flag incidental findings, manage follow-up workflows, and support quality assurance programs. Powered by Aliri, the radiology report analytics AI engine.
- NLP-powered extraction from free-text radiology reports
- Automated incidental finding detection and categorization
- Automated critical findings detection
- Follow-up management with configurable escalation rules
- Cohort searching with SNOMED and RadLex concepts
- Quality assurance dashboards for radiologist performance
Aliri+
Conversational AI · Plain-English Q&A
Aliri+ is the LLM-powered analyst layer on top of the Aliri AI NLP engine and your operational data. Ask plain-English questions across clinical findings and operational metrics — and get cited answers in seconds, with no SQL or dashboards to build.
- Natural-language Q&A across clinical findings (RadLex / SNOMED) and operational metrics
- Cited answers in seconds — no SQL and no dashboard building required
- Runs on the structured data Aliri AI and DImax already produce
- Available as a commercial LLM API or an Aliri-provided on-prem appliance on Apple Silicon
- PHI-safe deployment options for when data privacy is non-negotiable
AI Quality Framework
AIQ monitors and validates the performance of AI algorithms deployed in radiology workflows. As AI tools proliferate, AIQ provides the governance layer that ensures they perform as claimed — continuously.
- Continuous monitoring of AI algorithm performance in production
- Comparison of AI outputs vs. radiologist ground truth
- Drift reporting to detect and track AI model performance degradation over time
- Concordance/discordance reporting between AI predictions and radiologist findings
- Vendor-agnostic: works with any deployed AI tool
- Regulatory-ready audit trails for AI decision support tools
Operational Intelligence
Shift Analytics, Billing & Predictive Capacity
Go beyond clinical analytics with deep operational visibility — integrating shift scheduling, billing systems, and subspecialty performance data to drive efficiency and predict demand.
- Radiology shift data integration for detailed shift reporting and hourly productivity metrics
- Billing system integration for automated charge capture audits
- RVU and subspecialty analytics providing detailed radiologist performance metrics
- Predictive analytics for forecasting capacity vs. demand across departments
- Unified operational dashboards connecting scheduling, billing, and clinical data

VM Architecture
How DImax ingests, processes, and transforms healthcare data — from imaging modalities and protocol feeds through to analytics outputs.
Data Inputs
DImax connects to RIS and PACS via HL7 and DICOM data streams, while simultaneously onboarding data from scheduling systems (QGenda), databases, flat files, AI imaging outputs, and other data sources.
Core Processing — DImax VM
At the core sits the DImax VM, housing HL7/DICOM Listeners, Data ETL engine, Workflow Reconstruction module, Analytics engine, radiology report NLP, and the AIQ governance framework — all working in concert to normalize, enrich, and transform raw data.
Analytics & Monitoring Outputs
The platform delivers Performance Metrics, Workflow Insights, and AIQ Insights — giving radiology leaders real-time visibility into department operations, AI model performance, and workflow efficiency.

Why PresiNET
Built Different. Built for Healthcare.
We've spent 15+ years solving the specific integration and data challenges that make healthcare analytics hard.
Vendor-Agnostic
No rip-and-replace. No vendor lock-in.
HIPAA-Compliant
Built from the ground up for healthcare data privacy. All data handling meets HIPAA requirements.
Healthcare Protocol Ingestion
No complex HL7 interface work required, no workflow disruption.
Multi-Protocol
Native support for the full spectrum of healthcare data interchange standards.
Scalable & Proven
Designed to grow from single imaging centres to multi-site enterprise health networks.
studies per year

Standards Support
Many Protocols. Many Vendors.
Our platform was designed around the reality that healthcare data exists in many formats. We support the full spectrum of healthcare data interchange standards so you don't have to choose a vendor that forces you to standardize before benefiting from analytics.
AI Partner
Powered by Aliri AI
Aliri AI's NLP and clinical intelligence layer is powered by Aliri — the radiology report analytics AI engine. Aliri enables automated extraction, classification, and analysis of free-text radiology reports at scale. Building on that same structured output, Aliri+ adds a conversational LLM layer — ask plain-English questions and get cited answers in seconds.
Aliri+ · In Action
Talk to your DImax data
With Aliri+ integrated into DImax, you can ask plain-English questions across both clinical findings and operational metrics — and get cited answers in seconds. Two real conversations: one zoomed into a single patient's clinical trajectory, one across a department's operational TAT dataset.
Discuss with Aliri AI
Querying 21,148 rows across 1 table — AI will run SQL on demand.
Based on the records for patient bc60c5a4dea8, 72d002123d99, there appears to be a significant progression and fluctuation in findings, particularly regarding a right-sided pneumothorax (collapsed lung) and associated pleural effusions, tracked over a period in April 2016.
Key observations from the reports include:
- Initial Findings: Early reports mention “interval development” of issues and sludge in the gallbladder, but a major theme emerges around chest imaging.
- Pneumothorax Progression/Regression: Multiple reports track a right-sided pneumothorax. One report notes it was “slightly larger at 18 mm” compared to the previous day, while others note it was “largely unchanged” or that a chest tube had been inserted/adjusted.
- Interventions: The patient underwent multiple interventions, including the insertion and removal of chest tubes (“pigtail drain,” “small bore chest tube,” “large bore right chest tube”).
- Mixed Outcomes: Some reports indicate improvement (“aeration in the right lower lobe has improved,” “Further improved opacification”), while others show persistent issues (“Persistent right pneumothorax,” “Persisting right hemithorax volume loss”).
- Later Findings: Towards the end of the sequence, other issues are noted, such as a PICC line insertion and a whole-body bone scan for weight loss and elevated alkaline phosphatase, suggesting a complex clinical course with multiple concurrent problems.
In summary, the patient experienced a dynamic clinical course with a worsening and then fluctuating pneumothorax requiring multiple chest tube interventions, alongside other abdominal and systemic findings.
Discuss with Aliri AI
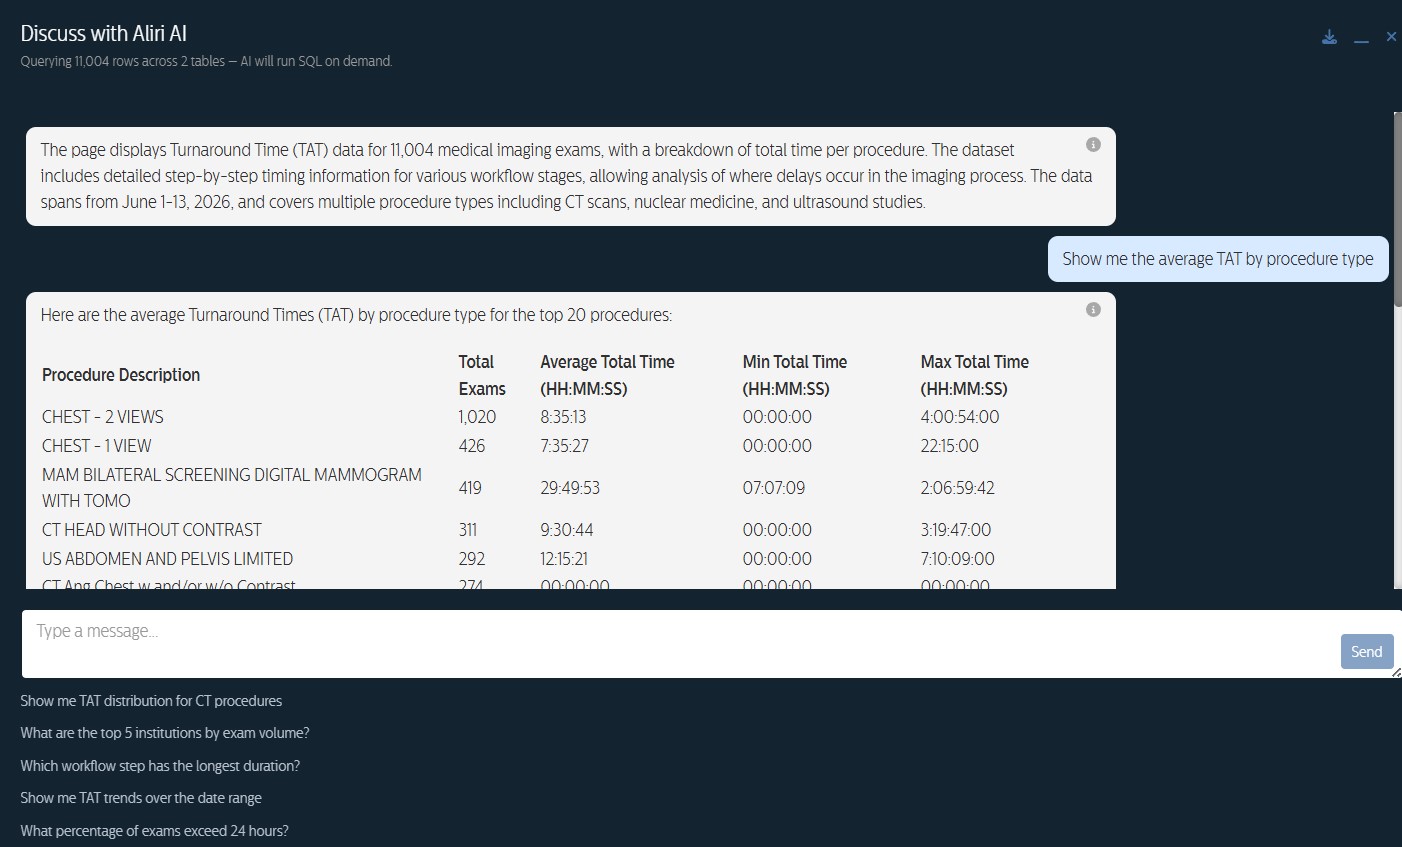
Querying 11,004 rows across 2 tables — AI will run SQL on demand.
Here are the average Turnaround Times (TAT) by procedure type for the top 20 procedures:
| Procedure Description | Total Exams | Average Total Time (HH:MM:SS) | Min Total Time (HH:MM:SS) | Max Total Time (HH:MM:SS) |
|---|---|---|---|---|
| CHEST - 2 VIEWS | 1,020 | 8:35:13 | 00:00:00 | 4:00:54:00 |
| CHEST - 1 VIEW | 426 | 7:35:27 | 00:00:00 | 22:15:00 |
| MAM BILATERAL SCREENING DIGITAL MAMMOGRAM WITH TOMO | 419 | 29:49:53 | 07:07:09 | 2:06:59:42 |
| CT HEAD WITHOUT CONTRAST | 311 | 9:30:44 | 00:00:00 | 3:19:47:00 |
| US ABDOMEN AND PELVIS LIMITED | 292 | 12:15:21 | 00:00:00 | 7:10:09:00 |
| CT Ang Chest w and/or w/o Contrast | 274 | 00:00:00 | 00:00:00 | 00:00:00 |
| …14 more rows | ||||
Aliri+ runs against the structured data DImax already builds — clinical findings from the NLP layer and operational metrics from your BI feeds. Available as a commercial API or as an Aliri-provided on-prem appliance on Apple Silicon when PHI safety is non-negotiable. Learn more about Aliri+ ↗

Proven Deployments
Trusted by Major Health Systems
Lumexa
Enterprise-wide deployment
SickKids Hospital
2.5M+ report NLP conversion
SMIL
Full platform deployment, 2023
UCSD
Detailed reporting
VetMed
Radiology Management
Mecklenburg
Charge capture audits
CIA
RAD Reporting
Munson
Operational Intelligence
HSN Sudbury
Operational Intelligence
SONIC
Data Normalization
SGRA
MIPS Reporting
Interested in the platform?
Reach out to discuss how PresiNET's platform fits your organization. You can visit our official distributor Bialogics.com for more details.